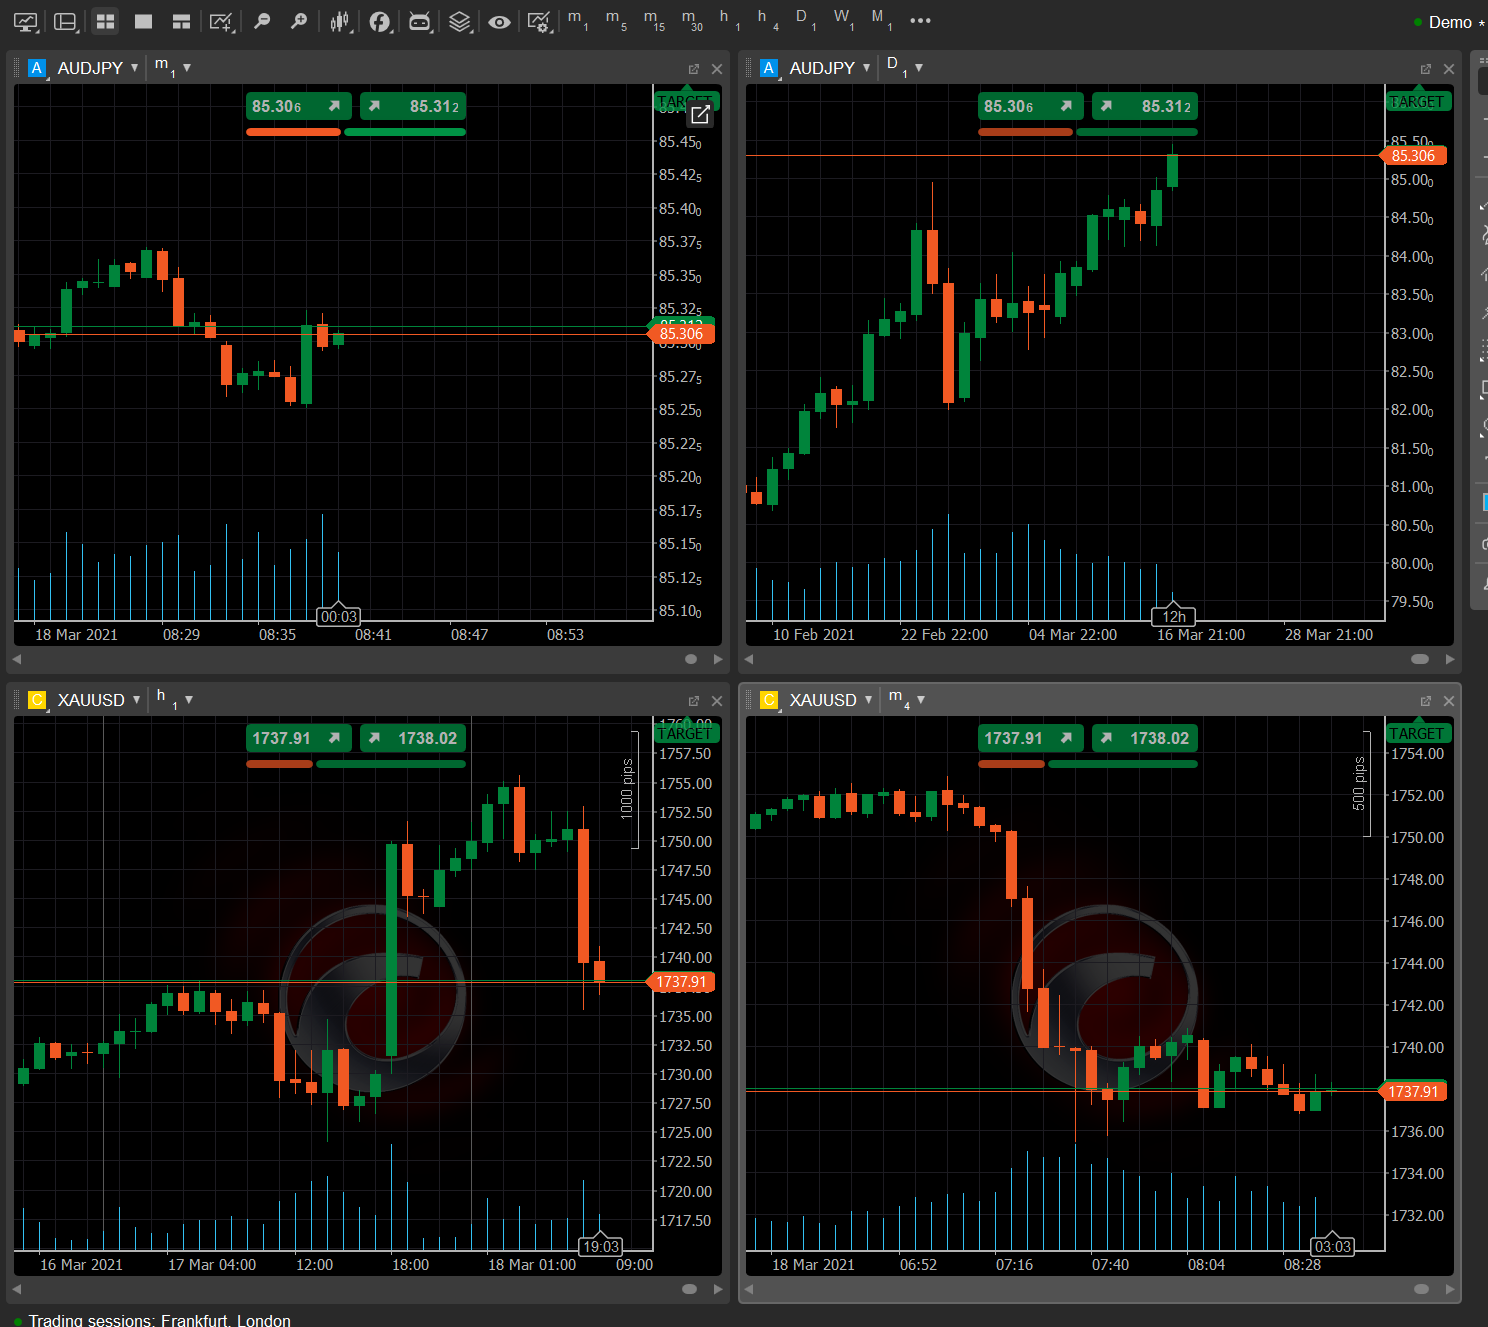
Ananda Linked Charts feature allows linking the charts together. While you can link multiple charts to one another, you are also able to link the Active Symbol Panel to the charts.
When two or more charts are linked together and you change the symbol in one of them, the symbol in the rest of the linked chart is also changed automatically.
If two charts and the Active Symbol Panel are linked together and the active symbol is changed in any of those sections, all other sections will change to the new symbol too.
This allows you to quickly change the underlying symbol for all of the linked charts simultaneously and quickly shift from one symbol to another without reconfiguring the chart setup at all.
Linking Charts #
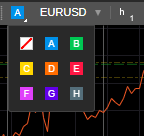
In the top left corner of each chart and the Active Symbols Panel, there is a color selector.
By default, the color selector is white and unlinked to any other chart.
When you click the color selector eight linking options become available as well as the option to unlink (white with a diagonal red crossing line).
If you apply blue A to two charts and green B to two other charts, and then change the active symbol in one of the green B charts, the link chart will be synchronized and also change its active symbol.
The blue A charts will not be affected. If you also apply green B to the Active Symbol Panel then the active symbol in this section will also synchronize with the other two green B charts.
To unlink a chart, click on the color selector and select the unlink option (white with a diagonal red crossing line).
Note that Ananda Linked Charts functionality is different from the Chart Templates because it allows changing the symbol underneath the chart setup, and templates are applied on top of a selected symbol.
Using Workspaces, you would need to open a new chart, set the timeframe and then apply the saved templates on top of the chart.
Using Linked Charts you can swiftly change focus from one symbol to another. Chart templates remain useful for saving the chart setups you are not actively using.


