The Chart Toolbar is located at the top of the currently opened chart. It contains the following options:
- Workspaces
- Layouts
- Chart Modes
- Zoom In/Out
- Chart Type
- Indicators
- cBots (Trading Robots)
- Chart Objects
- Hide All Drawings
- Chart Templates
- Bar Periods (Time Frames)
Workspaces #
Workspaces is a Ananda cloud feature that allows users to set up and save different Ananda settings that can be used from multiple accounts, with different brokers, and on different devices.
One can create as many Workspaces as he needs and use them across different brokers and different computers, by logging in with his Ananda ID.
Workspaces organize various software settings:
- Charts and Chart configuration
- QuickTrade parameters
- Colour theme, Layout, Language, and sound settings
- Asset display settings
- Symbols List settings
- In-app notification settings
Note
Workspaces created in Ananda Web do not work in the desktop version of Ananda and vice versa.
Managing Workspaces #
After the first login, Ananda automatically creates a new Workspace (My Workspace) for you. All the changes you make will be automatically saved in My Workspace.
To create a new Workspace, hover over the My Workspace drop-down to the upper right of the screen on the cTID bar, and select Save WorkSpace, type in the name, and click Save.
To delete a Workspace, hover over the My Workspace drop-down list, then click the x sign next to the Workspace that you want to delete and confirm your action.
All changes are automatically saved when you switch to another Workspace or close the Ananda Web app.
Layouts #
The Layouts settings allow showing or hiding the Active Symbol Panel to the right and the TradeWatch to the bottom. Hover over the Layouts icon and select the desired options from the drop-down.
Chart-Modes #
Ananda offers three modes of the chart’s layout: Multi Chart, Single Chart, and Free Chart modes. These modes change the layout of the charts on the screen.
You can switch the Chart Modes from the Instruments toolbar next to the chart.
Click Multi-Chart mode () on the Instruments toolbar to enable Multi-Chart mode. This mode is active by default.
You can add more charts and drag them around in the Charts section.
Learn how to add new charts from the Open Charts section above.
Click Single Chart mode () on the Instruments toolbar to enable Single Chart mode.
In this mode, only one chart takes all the Charts area of the screen, and the other opened charts are displayed in the form of the tabs to the top of the chart area.
You can switch between the charts by selecting the tabs above. To add a new chart, click the plus icon () next to the tabs.
Click the Free-Chart mode () on the Instruments toolbar to enable Free-Chart mode. It is similar to Multi-Chart but also allows resizing each chart individually.
Zoom In/Out #
Hover over the Zoom In or Zoom Out button in the chart, and use the corresponding buttons or zoom slider to change the scale of the chart.
The Price Axis (vertical) and the Time Axis (horizontal) scale automatically when you change the zoom level.
Alternatively, use the hotkeys + and - for zoom in and zoom out respectively.
Chart Type #
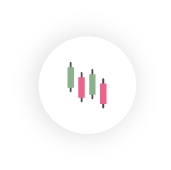
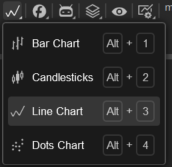
There are 4 chart types available in Ananda Desktop:
Bar Chart (OHLC) #
Provides the opening, closing, high, and low prices for the selected time frame in the form of bars.
Candlesticks Chart #
Composed of a series of open-high-low-close (OHLC) candles set apart by a time series.
Candlesticks chart is considered the most popular chart type, but you can check out any type to find out which one works better for you in a particular situation.
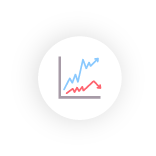
Line Chart #
Draws the line between the closing prices for the selected time frame.
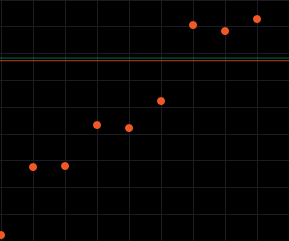
Dots Chart #
Displays only the closing prices for the selected time frame as dots.
Hover over the corresponding button (Candlesticks by default) in the Charts Favorites, and select the desired chart type from the submenu.
Alternatively, right-click anywhere on the chart and select Chart Type from the drop-down.
Alternatively, use the shortcut Ctrl+1, Ctrl+2, and Ctrl+3 to switch
between the Bar, Candlestick, and Line chart respectively.
Indicators #
The Indicators are special tools that are used for trading technical analysis. An Indicator performs certain mathematical calculations based on the price and/or volume of the symbol over time.
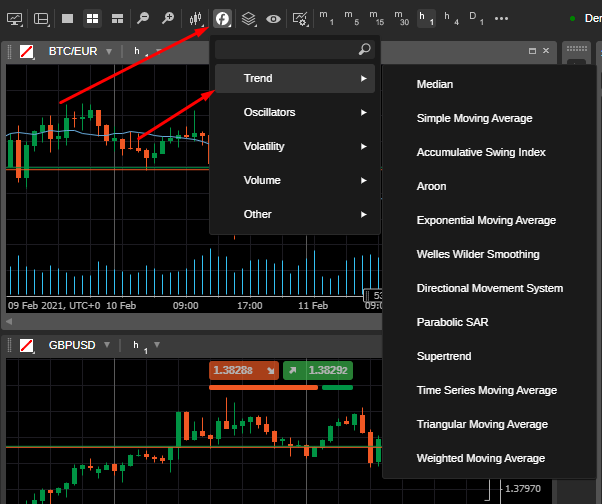
There are 58 built-in standard indicators in Ananda. They are sorted by groups depending on their function: Trend, Oscillator, Volatility, Volume, and Other.
Adding an Indicator #
Hover over the Indicators button, then hover over the group of Indicators from the drop-down and click on the desired Indicator.
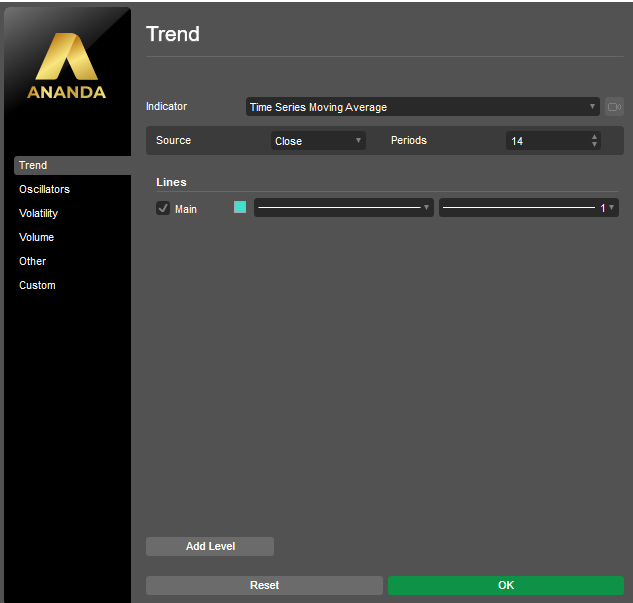
The Indicator menu will pop up. Here you can customize the indicator line color, thickness, and set the Indicator Time Frame. When done, click OK to apply changes and add the indicator to the chart.
Alternatively, use right-click directly on the chart to proceed to the Indicator menu.
Note that some of the Indicators appear directly in the chart and the others below it, in the separate chart area.
Modifying and Removing the Indicators #
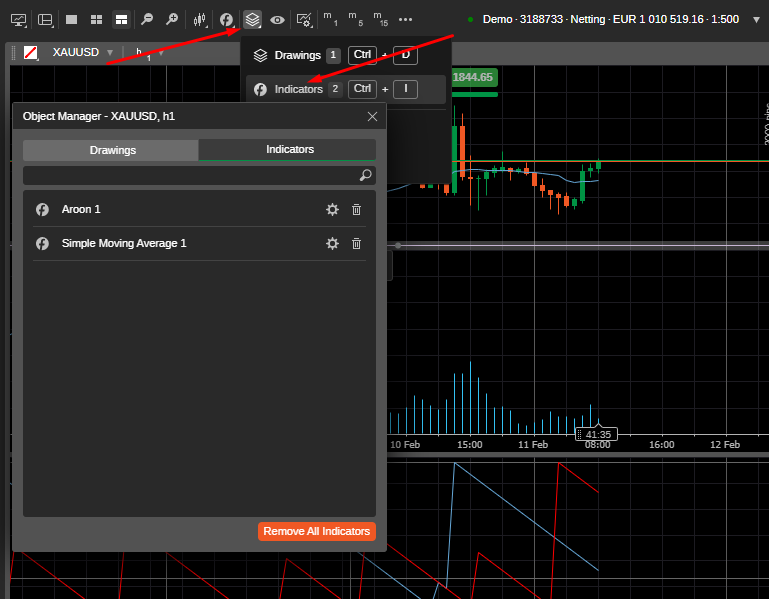
To modify an indicator, hover over the Objects icon and select Indicators. Click on the desired Indicator in the list.
The selected indicator will be highlighted on the chart and the Indicator menu will pop-up. Modify your indicator and click Ok to save changes.
Alternatively, click ‘x’ to remove the desired indicator from the chart.
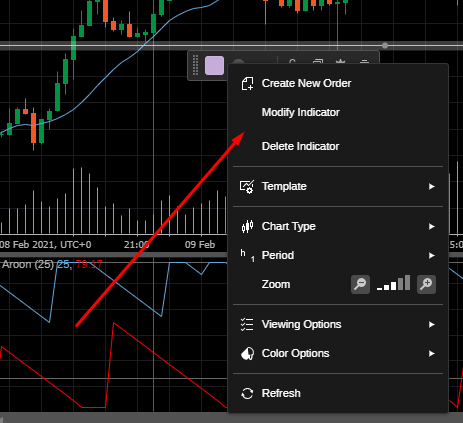
If you would like to modify or remove an indicator located in its separate area below the chart, right-click on the indicator area and select Modify Indicator from the drop-down.
The Indicator menu will pop up. Edit your Indicator and click Ok to apply changes. Alternatively, click Delete Indicator to delete it from the chart.
cBots (Trading Robots) #
cBots are Ananda Automate trading robots that trade automatically based on the technical analysis signals. You can add and manage cBots directly from the Charts Favourites.
Check the cBots section of the present documentation to learn more about trading robots.
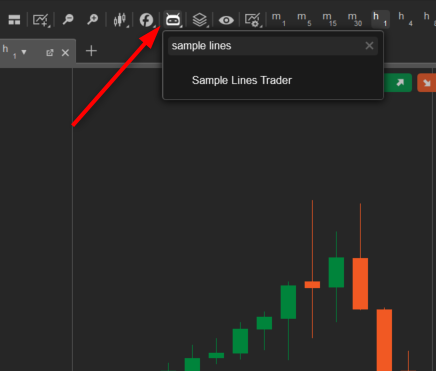
Hover over the cBots button in the Charts Toolbar to expand the cBots section. Here you can find the desired cBot by typing in its name or part of it in the search box.
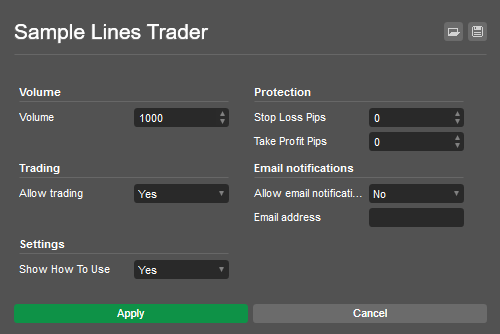
Select the desired cBot from the list to open its menu. Enter the required values to complete the cBot settings and click Apply. Note that the settings may vary depending on cBot.
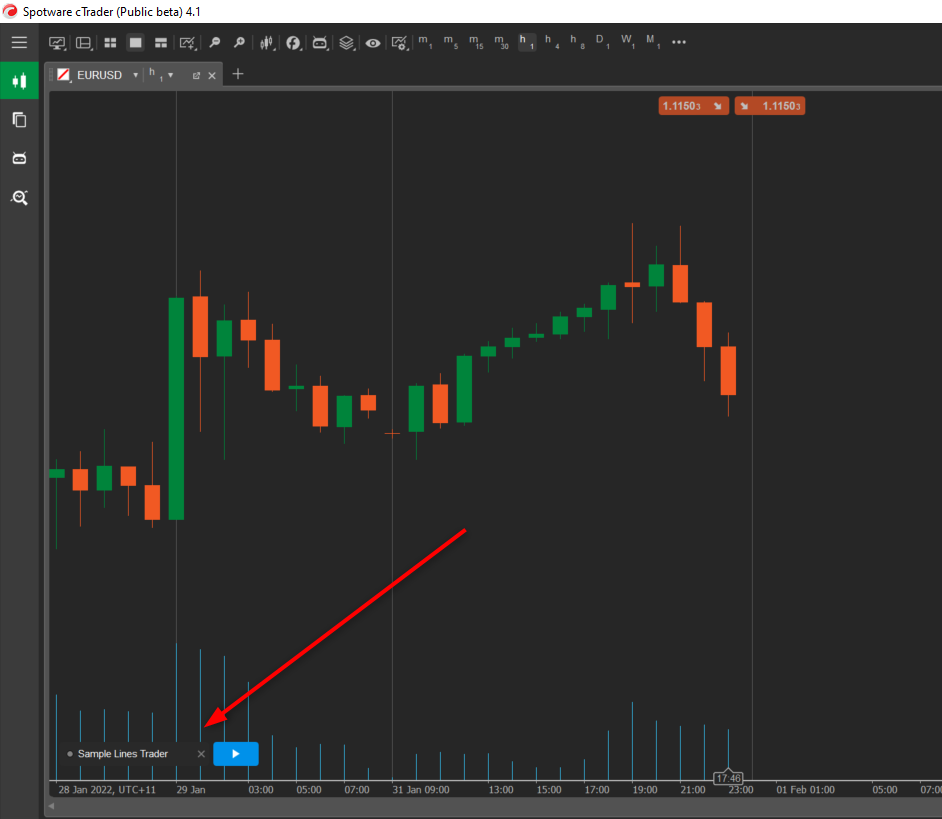
When done the new instance of cBot will appear on the chart. Double click on it to open its settings again. Click Play to start the cBot. Click the cross to remove a cBot from the chart.
Chart Objects #
Ananda provides a suite of various chart objects for better trading and deeper analysis.
Check the Line Studies and Chart Objects section of this documentation for the detailed description of how to use them.
The Objects button of the Chart Favourites panel gives access and allows managing those objects from the chart.
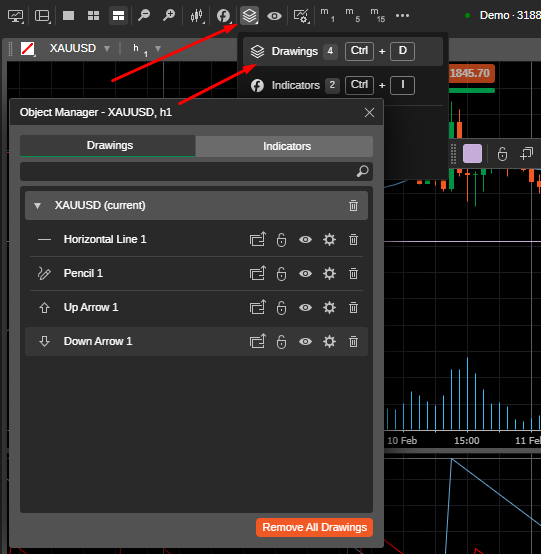
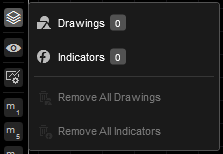
Hover the Objects icon to proceed to the chart object menu. The number of drawings and indicators currency placed on the chart is displayed next to the respective item.
Click Remove All Drawings or Remove All Indicators to remove all the objects from the chart respectively.
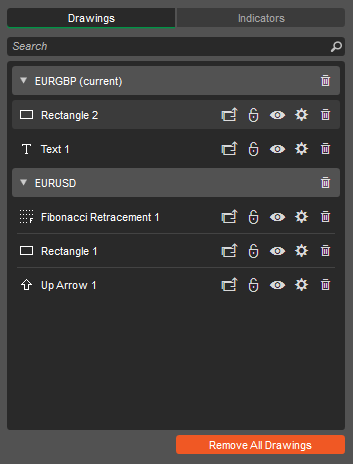
Select Drawings or Indicators to proceed to the respective chart Object Manager. Use the Symbols dropdowns to view the list of all the objects for the specific symbol chart (or Cross-Symbol).
The following options are available for the chart objects:
- Move to current/Move to cross-symbol (for Drawings only) - click to move the chart object to the cross-symbol chart (which means the object will be placed by default on every symbol chart you open), or move it back to the current chart only.
- Lock/Unlock Object (for Drawings only) - when an object is locked, you can not move it on the chart. Use this option to avoid the accidental movements of the objects.
- Hide/Unhide Object (for Drawings only) - click to hide or show the object on the chart.
- Settings - click to open chart object settings.
- Remove - click to remove the chart object completely. Alternatively, use the Remove icon in the symbol drop-down tab to remove all chart objects for the symbol (or cross-symbol), or click Remove All Drawing/Indicators.
Use the toolbar next to the desired chart object to move your object to all the opened charts, lock it on the chart, hide, open its settings, or remove.
Alternatively, you can select an object in the chart and press Del on your keyboard to remove it.
Note
As long as you haven’t added any objects to the chart, no objects will be displayed in the Objects drop-down.
Hide All Drawings #
Use the Hide All Drawings feature to hide or unhide all the drawings currently placed on the chart. When you unhide drawings they appear in the same place with the same parameters set.
Chart Templates #
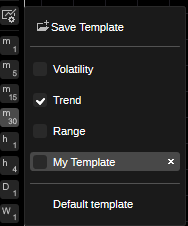
The Chart Templates allow quickly changing various chart settings and viewing options simply by changing the template. There are three chart templates available by default:
- Range – optimized for analyzing the price range (Candlesticks, medium scale, Relative Strength Index Indicator, Stochastic Indicator, and tick volume enabled);
- Trend – optimized for analyzing the trend (Line Chart, small scale);
- Volatility – optimized for analyzing the volatility (Candlesticks, medium scale, Bollinger Bands, and Standard Deviation Indicators enabled).
The default template is Candlesticks, medium scale, no Indicators.
To change the chart template, hover over the Chart Template button, and check the desired template. The selected template will be applied to all new charts being opened.
Custom Chart Templates #
Ananda allows creating as many custom chart templates as you need.
To save all the various chart settings as a new template, hover over the Chart Template button, click Save Template, then type in the template name, and click Save.
To save changes to an existing template, hover over the Chart Template button, click Save Template, then click on the existing template, click Save, and confirm the overwrite.
Note
You cannot edit the Default template.
To delete a template, hover over the Chart Template button, and click the ‘x’ next to the template you would like to delete.
Bar Periods #
Ananda Desktop charts can be displayed based on a large number of predefined bar periods. Bar periods include standard time based bars, tick based bars, renko bars and range bars.
Tick-based Bars #
Tick-based bars use a predefined number of pips to create a bar. For example a 50 ticks bar includes price information for 50 ticks. Every 50 ticks, a new bar is added to the chart.
Standard Time-based Βars #
Standard Time-based bars display the price information within a given timeframe. For example a 1 hour bar includes price information for 1 hour. Every hour, a new bar is added to the chart.
Renko Βars #
Renko bars display a new bar as soon as the price has moved a certain distance in pips from the previous renko bar open or close price.
For example a 5 pips renko bar is added to the chart every time the price moves 5 pips from the opening or closing price of the previous renko bar. You can read more about Renko bars here.
Range Bars #
Range bars display a new bar as soon as the price has moved within a certain range of pips.
For example a 5 pips renko bar is added to the chart every time the price moves within a range of 5 pips.
You can read more about Range bars here.
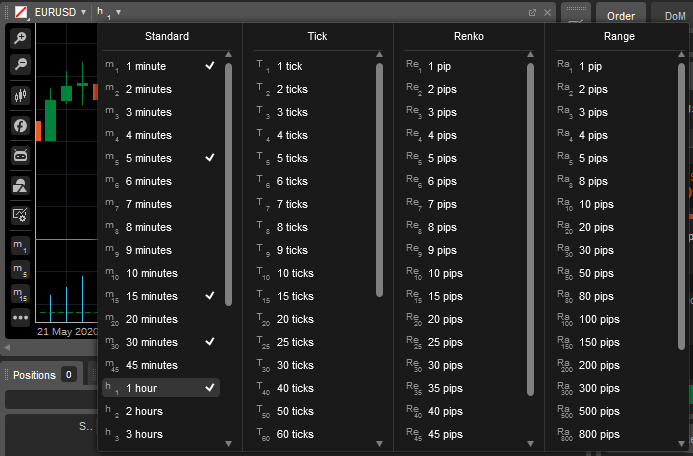
By default, the chart is built based on the 1-hour time frame () and several time frame options are available in the Chart Toolbar. Click on any of them to apply it to the chart immediately.
Click the Time Frame button to the top of the chart to see all the available Time Frames - Standard,Ticks, Range and Renko.
The Standard Time Frame allows selecting the desired time period from 1 minute to 1 month to apply for the chart. I the Ticks Time Frame you can select the number of ticks from 1 to 1000.
In the Range bar, all price bars are of equal length. So for example, if you set a 10 pip range bar, then all bars are of 10 pips range (high to low, or low to high).
In range bars, the close of a bar is always equal to the open of the next bar. The range is measured as a high and low and not close.
In the Renko bars, every bar is of the same length (including reversals, but price must travel two times the Renko bar in the opposite direction).
Mark the desired items to enable their quick access buttons directly from the Favourites Panel.
The buttons actually show the current time frame or the number of ticks in its title. For example, T10 () means Tick chart, 10 ticks.
Use the Up and Down arrow keys on your keyboard to switch the timeframes.
Countdown box #
Ananda shows live countdown to the next bar/line/point/candlestick in time units or ticks. Find the countdown box () on the time axis at the bottom of the chart.


