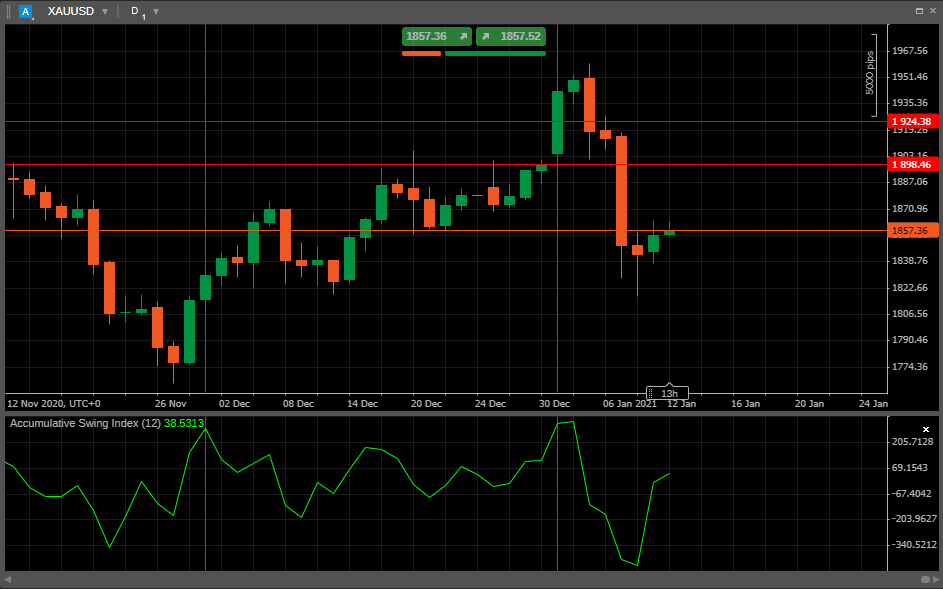
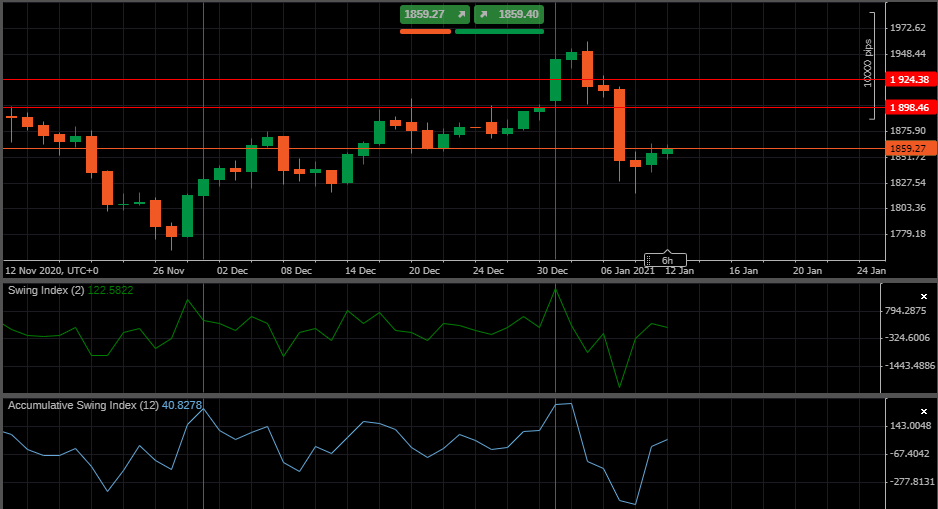
The ASI (Accumulative Swing Index) indicator is a technical tool used for estimating the long-term trend in a symbol’s price by using its opening, closing, high and low prices.
It was created as an attempt to find the swing line within the bar. Essentially, the ASI is an accumulation of the Swing Index, which is a technique for very short-term trading that is intended to predict future short-term price action.

In Ananda applications, the ASI tool is charted as a trendline with configurable parameters such as Limit Move Value (Maximum price change during a trading session), and the line colour and thickness.
It is typically charted as a standalone trendline graphed similar to volume bar charts. Both the Accumulative Swing Index and the Swing Index can be added to a technical analyst’s chart diagram.
To understand the principles of how to use the Accumulated Swing Index Indicator, we recommend you to follow the link and read how the [Swing Index] technique works first.
The Swing Index Value, in its turn, is accumulated form the Accumulated Swing Index trendline. This trendline value is typically placed within a range of 100 to -100.
As a price-oriented index, it will follow the candlestick pattern of a price. It is often used for futures trading but can be used for analyzing the price trends of any other assets as well.

The ASI is often used for supporting the confirmation of breakouts in conjunction with trading channels. Generally, when the ASI is positive, it indicates that the long-term trend will be higher, and when the ASI is negative, it suggests that the long-term trend will be lower.
Also, the Accumulative Swing Index can be used for potential buy and sell signals.
A trader might consider a buy signal when the Accumulative Swing Index breaks above a downward trendline or, in a price consolidation period, above resistance. And, on the contrary, a trader might consider a sell signal when the Accumulative Swing Index breaks below an upward trendline or, in a price consolidation period, below support.
In summary, the ASI indicator is best used as a confirmation tool with other technical indicators and charting patterns like support and resistance indicators.
In Ananda, you can find the Accumulated Swing Index indicator among the other built-in indicators. See the Indicators section to learn more about how to use them.


