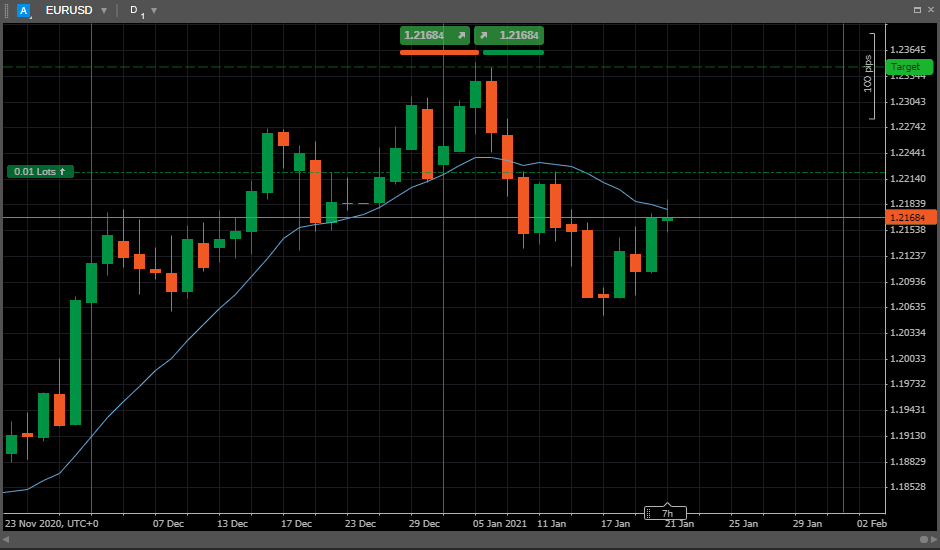
The SMA (Simple Moving Average) is a technical indicator that calculates the average in a selected range of prices, usually closing, by the number of periods in that range.
It is based on the Moving Average, which is a calculation for analyzing the data points by creating the series of averages of the specific subsets of the bigger data set.
The SMA is calculated by adding the recent closing prices and dividing the sum by the number of time periods.
The SMA is simply the average price over the specified period. The average is called “moving” because it is plotted on the chart bar by bar, forming a line that moves along the chart as the average value changes.
Example
For example, you can add the closing price values of a symbol for a specific number of time periods, and then divide this total sum by that same number of periods. Therefore, the SMA can be calculated with the following formula:
SMA = [P1+P2+P3+...+Pn] / n
where:
Pn = the price of an asset at the specific period n.

n = the number of total periods.

Usage #
The SMA is often used to determine the trend direction. If the SMA is moving upwards, then the trend is up, and vice versa. The long period SMA is commonly used for the long term trend, and the shorter period SMA is typically applied to estimate the shorter term trend.
The SMA can also be used for smoothing the price data with the other technical indicators. The longer the period of the SMA, the smoother the result, but the more the lag between the SMA and the source.
The SMA crossing the price is often used for triggering trading signals. When prices cross above the SMA, one should go long or cover short; when they cross below the SMA, one should go short or exit the long.
Also, you can use several SMA indicators with different time period at the same time, as an SMA crossing SMA is another common trading signal.
When a short period SMA crosses above a long period SMA, one should go long, and one should go short when the short-term SMA crosses back below the long-term SMA.
Limitations #
There is no clear opinion among traders, whether or not the main attention should be paid to the most recent dates or more distant data, as it happens in some other Moving Average indicators.
Many people from the industry believe that the new data better reflects the current trend. On the other hand, privileging certain dates than others may affect the trend.
Therefore, the SMA may some times unpredictably rely too heavily on the outdated data since it treats the 10th or 200th day’s impact just as much as the first or second.
In Ananda, you can find the Simple Moving Average indicator among the other built-in indicators. See the Indicators section to learn how to use them.


